Carsharing 데이터 분석 2: Trip의 수, 추세 등
2019-10-02
- 일자별 Trip의 수
- 스팟별 Trip의 수
- 시작 Station, 도착 Station 별 개수
- Trip을 시작하는 특정 날짜 및 시간에 대한 Count
- 2019년 1월 1일부터 시간대별 추세
- 요일별 사용자 수 Count
Table: dump table
| 필드 이름 | 유형 |
|---|---|
| id | INTEGER |
| created | TIMESTAMP |
| updated | TIMESTAMP |
| deleted | TIMESTAMP |
| status | INTEGER |
| pickup_time | TIMESTAMP |
| return_time | TIMESTAMP |
| options | INTEGER |
| purpose | STRING |
| car_id | INTEGER |
| exemption_id | STRING |
| paycard_id | STRING |
| pickup_spot_id | INTEGER |
| return_spot_id | INTEGER |
| user_id | INTEGER |
1. 일자별 Trip의 수
SELECT DATE(pickup_time), COUNT(id) as count
FROM carsharing_data.dump
GROUP BY date
ORDER BY date;
2. 스팟별 Trip의 수
SELECT pickup_spot_id, COUNT(id) as count
FROM carsharing_data.dump
GROUP BY prickup_spot_id
ORDER BY count DESC;
3. 시작 Station, 도착 Station 별 카운트
SELECT pickup_spot_id, return_spot_id, count(id) as trip_cnt
FROM carsharing_data.dump
GROUP BY pickup_spot_id, return_spot_id
ORDER BY trip_ctn DESC;
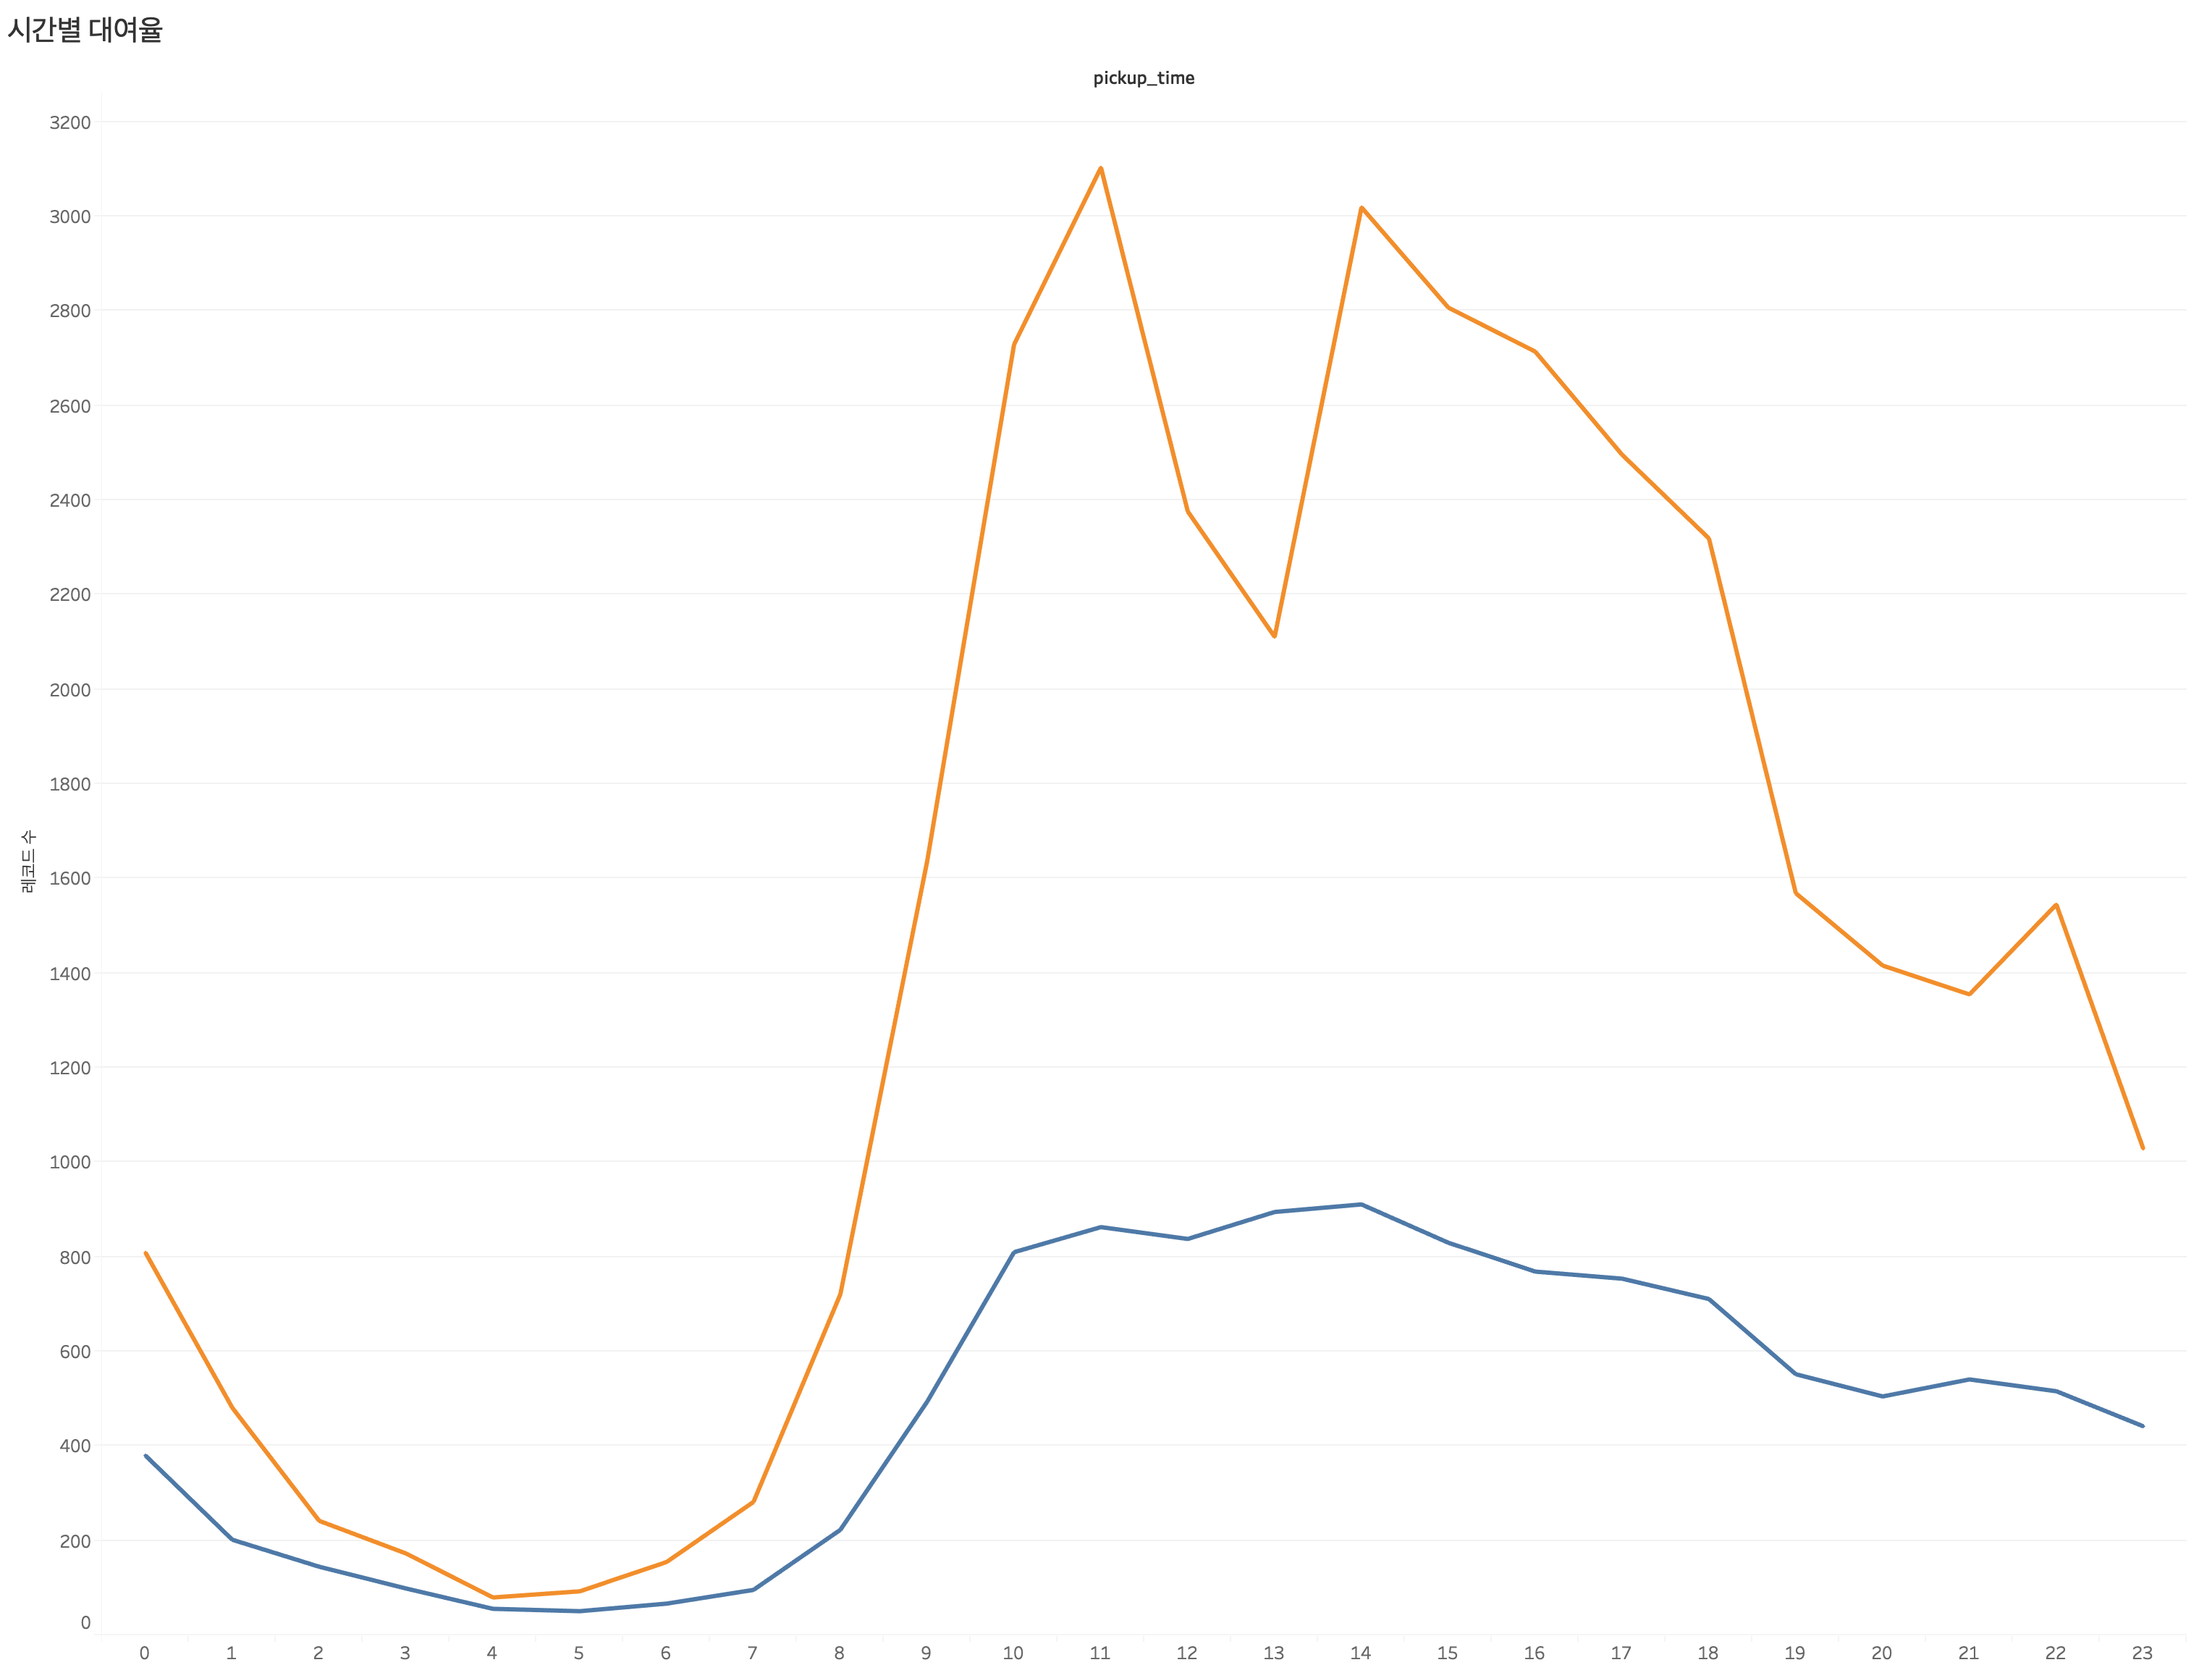
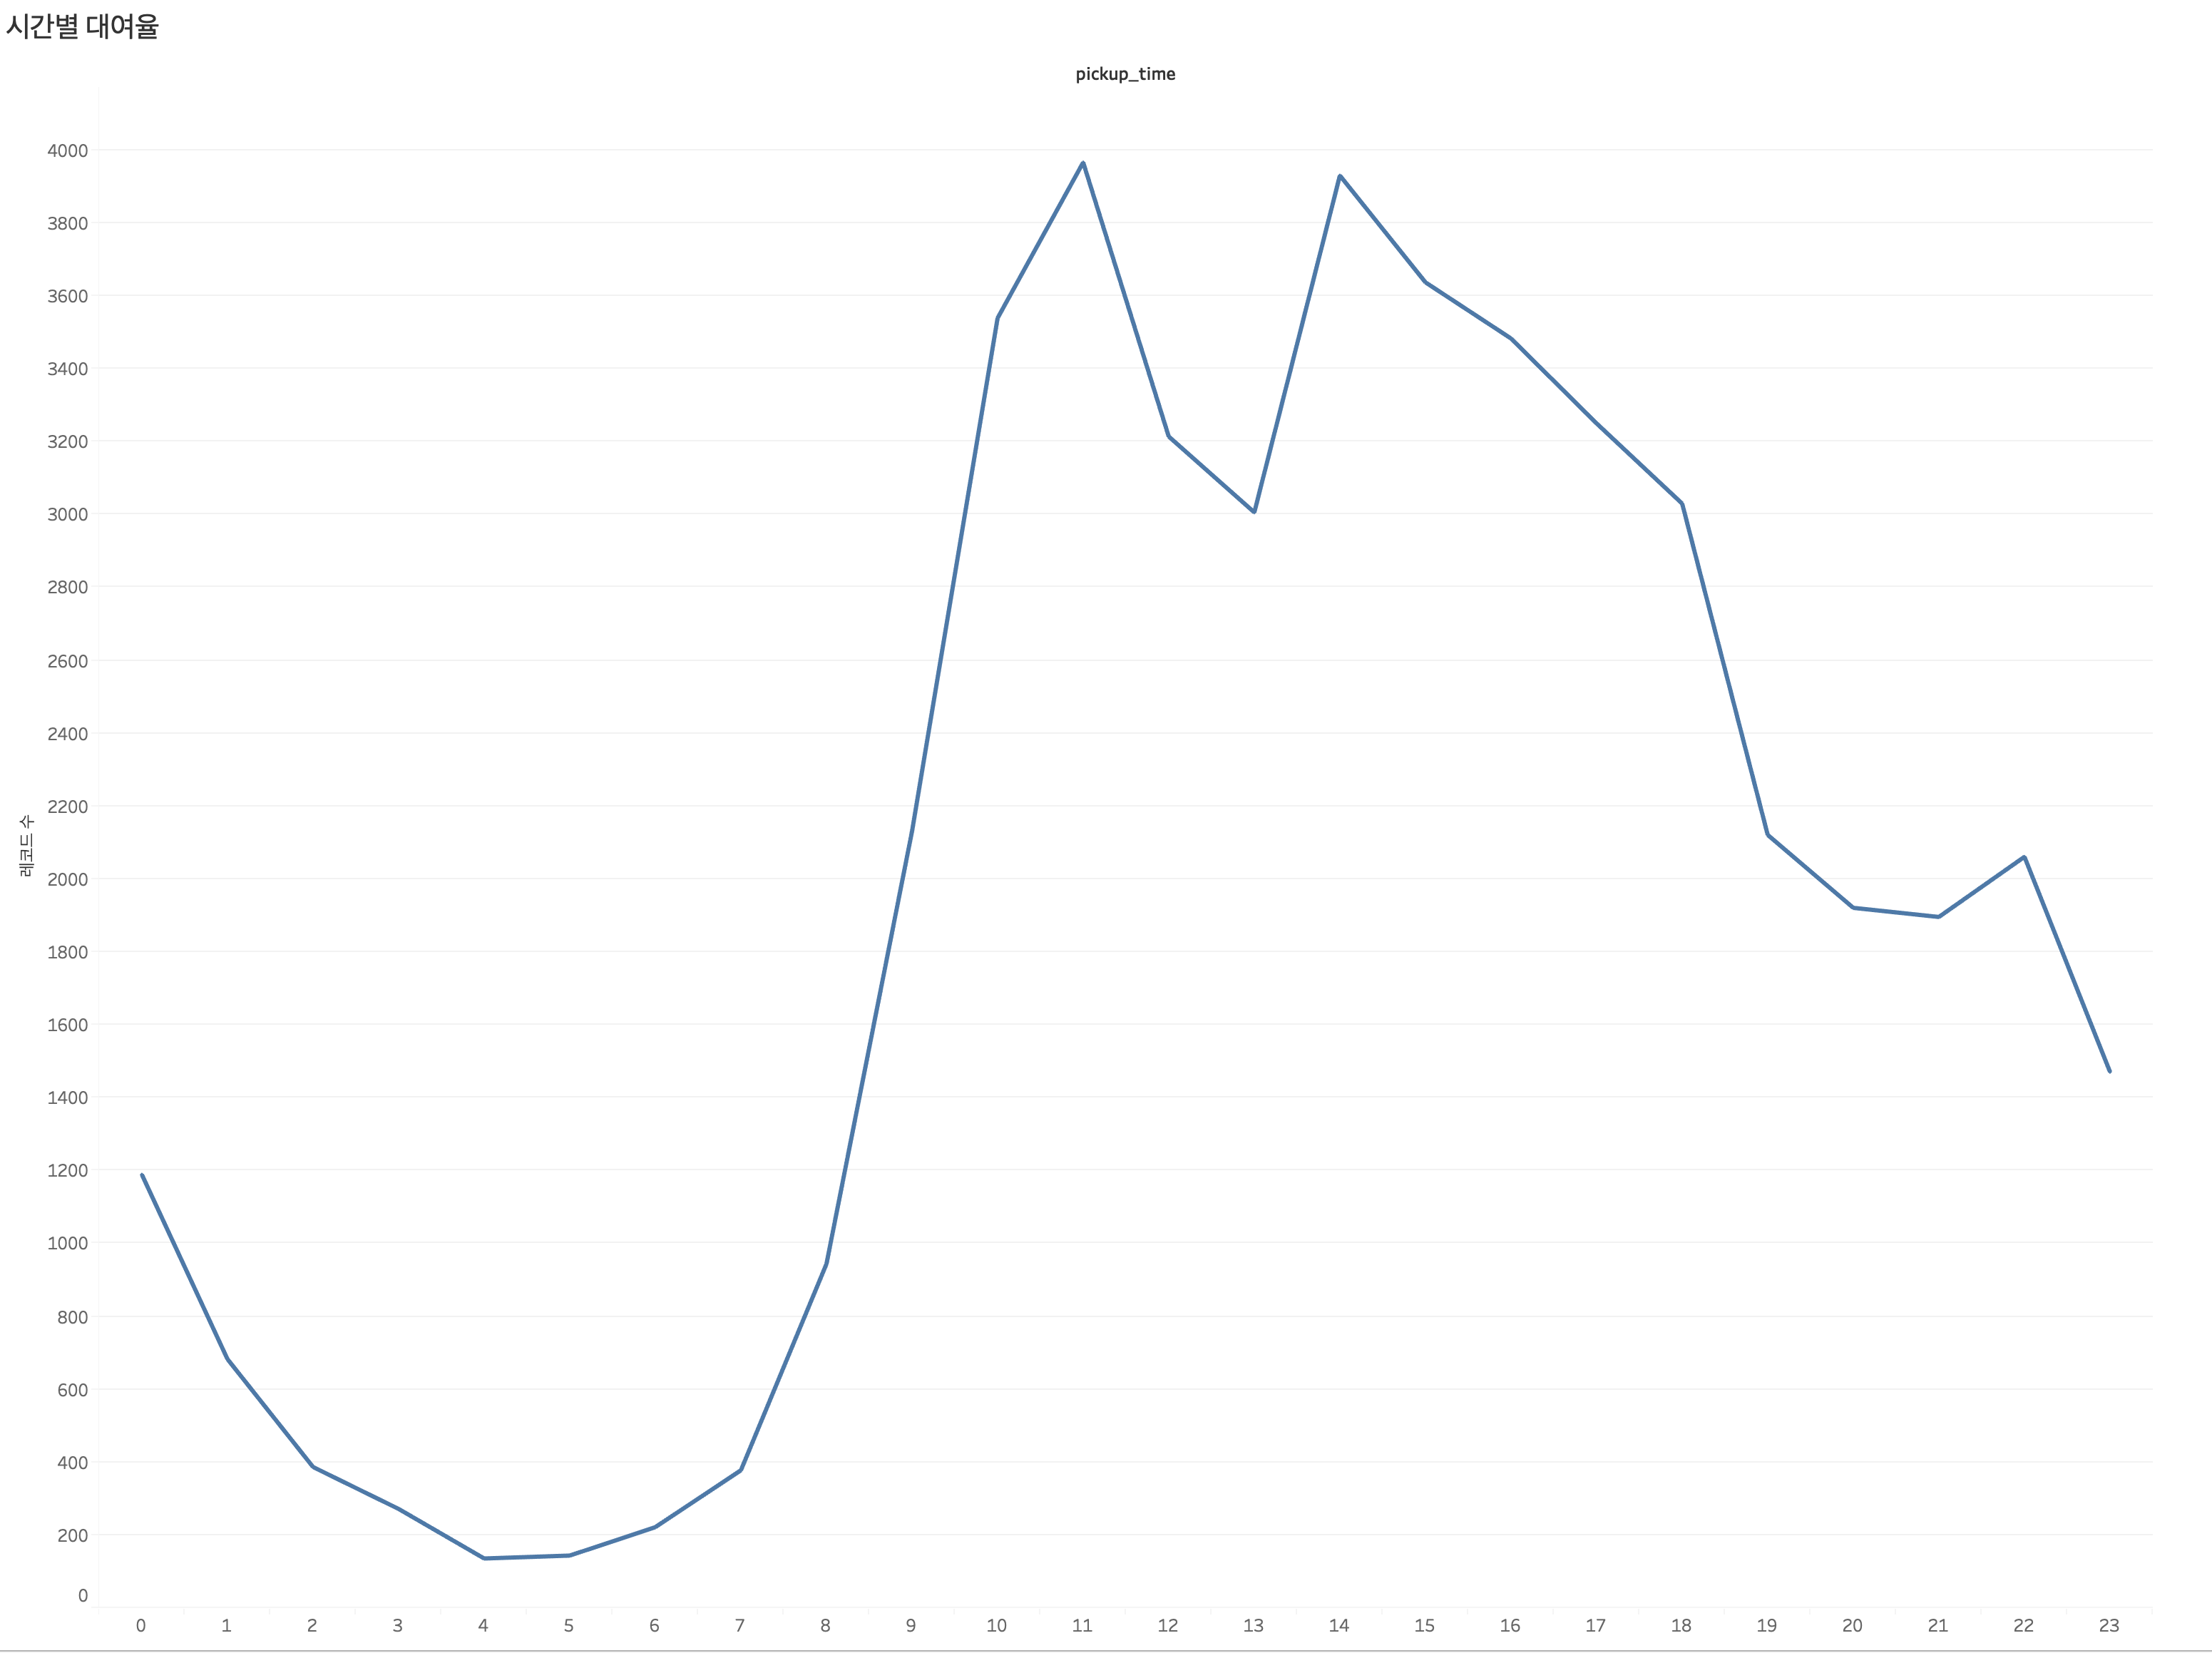
4. Trip을 시작하는 특정 날짜 및 시간에 대한 카운트
SELECT start_hour, count(id) AS count
FROM (
    SELECT EXTRACT(hour FROM pickup_time) AS start_hour, *
    FROM carsharing_data.dump
)
GROUP BY start_hour
ORDER BY count DESC
5. Trip을 시작하는 특정 날찌 및 시간에 대한 카운트
SELECT start_hour, count(id) AS count
FROM (
    SELECT DATETIME_TRUNC(DATETIME(pickup_time), hour) AS start_hour, *
    FROM carsharing_data.dump
)
GROUP BY start_hour
ORDER BY count DESC
DATETIME_TRUNC(datetime_expression, part)
DATETIME객체를PART단위로 자르며 아래의part값을 지원
MICROSECOND,MILLISECONDSECOND,MINUTE,HOUR,DAY,WEEK,MONTH,YEAR
SELECT
    DATETIME "2008-12-25 15:30:00" AS original,
    DATETIME_TRUNC(DATETIME "2008-12-25 15:30:00", DAY) AS truncated;
| original | truncated |
|---|---|
| 2008-12-25 15:30:00 | 2008-12-25 00:00:00 |
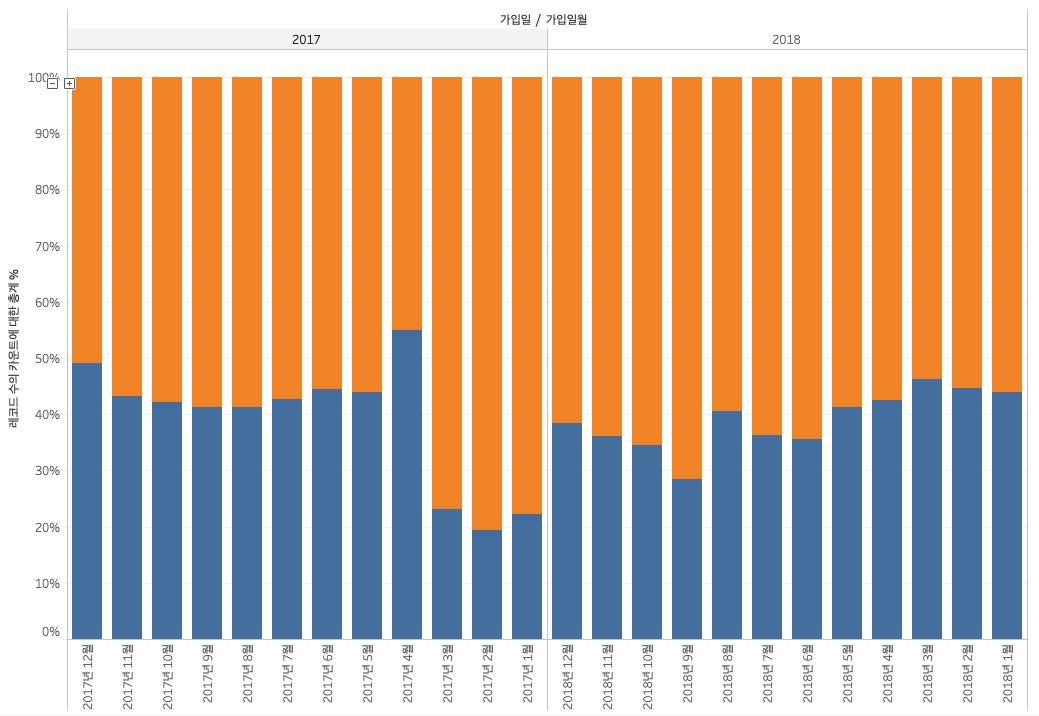
Tableau Visualization
Proportion of customers
Peaks
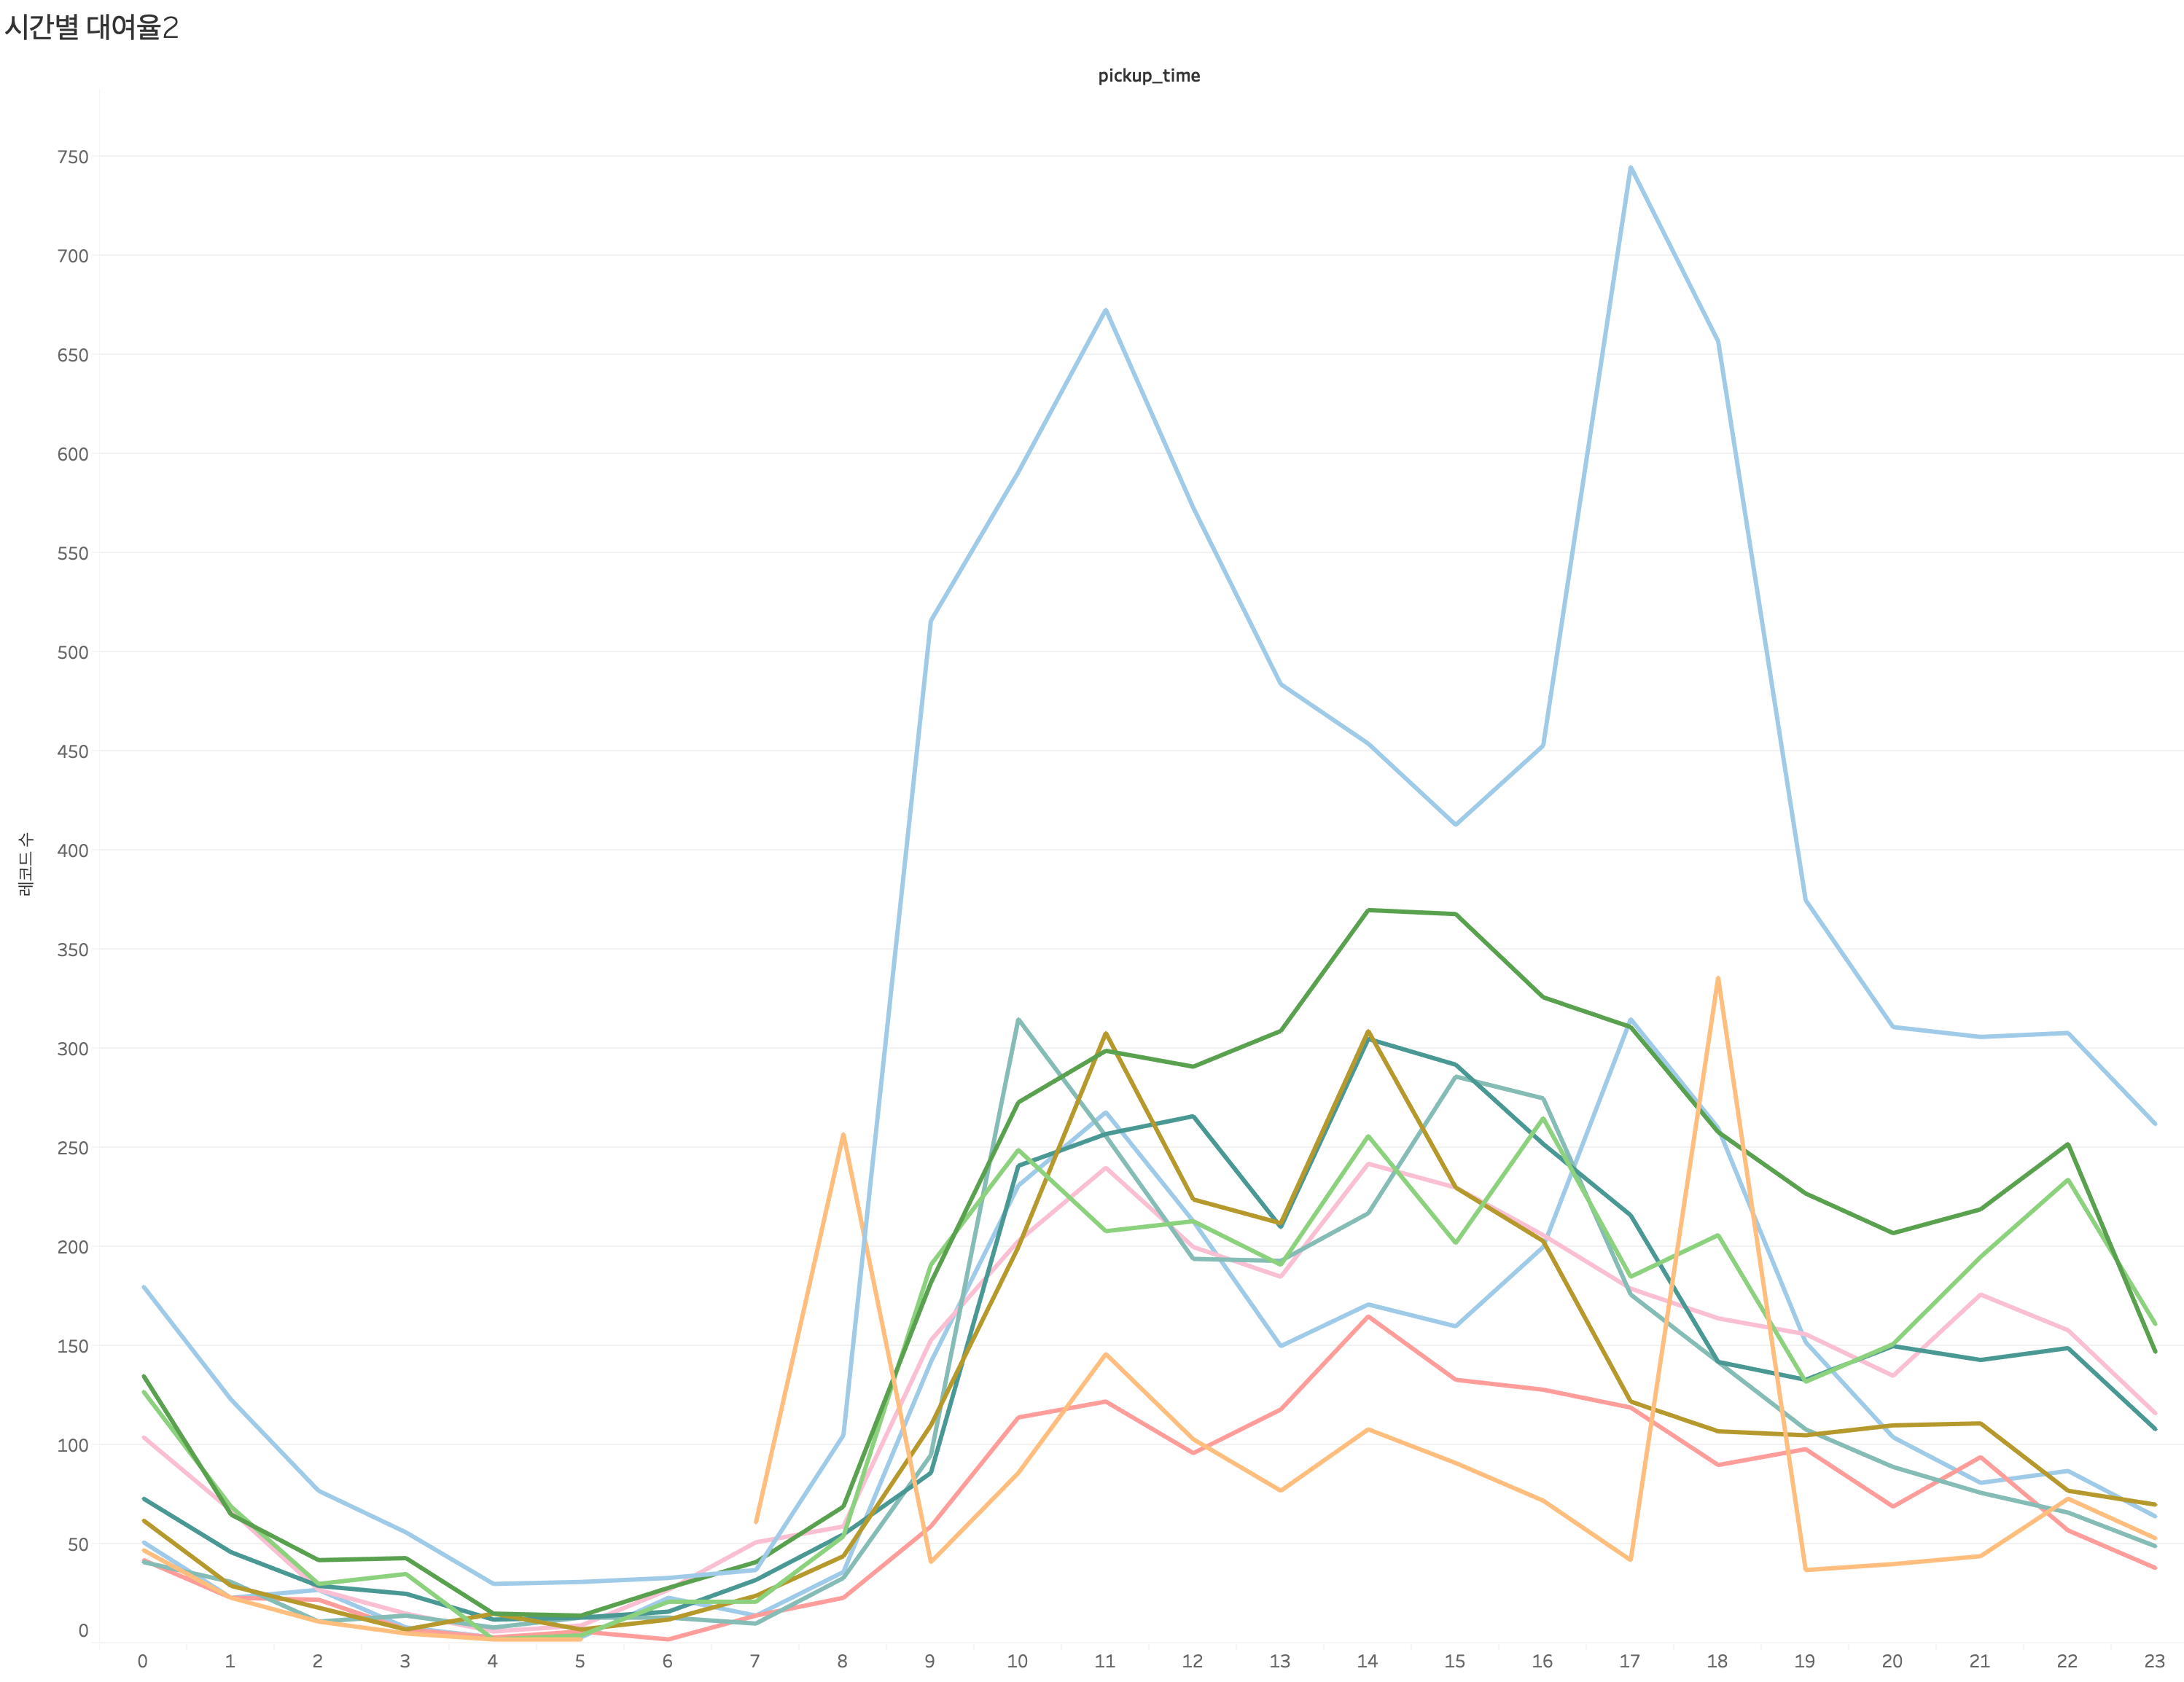
Peaks Weekdays Or weekends