CitiBike 데이터 분석-2
Google Bigquery, Datastudio, Colab의 환경에서 분석하고 최종적으로 주요 지표에 대한 대시보드 구성. 평소 담당자의 추측/감각에 의존하여 운영하던 방식에서 벗어나 데이터 기반의 의사결정을 지원. 회원, 시간, 날짜, 기상, 지리적 조건, 매출, 하드웨어 수명 관리 등 데이터 기반의 영업(매출), 마케팅, 운영 위해 주요 지표를 선정하고 대시보드를 통해 내부 구성원에서 공유.
다양한 지표 살펴보기
Riders per Age Group
Distribution of Riders per Hour of the Day (weekdays)
Median Age per Departure Station
Rides by Hour of the Day
Duration Minutes
Trips Between Manhattan and Outer Boroughs
Temperature vs Daily Usage
Precipitation vs Daily Usage
Snow Depth vs Daily Usage
총 trip의 수
SELECT COUNT(trip_id)
FROM FROM `bigquery-public-data.austin_bikeshare.bikeshare_trips` LIMIT 1000
| 행 | fO_ |
|---|---|
| 1 | 1179147 |
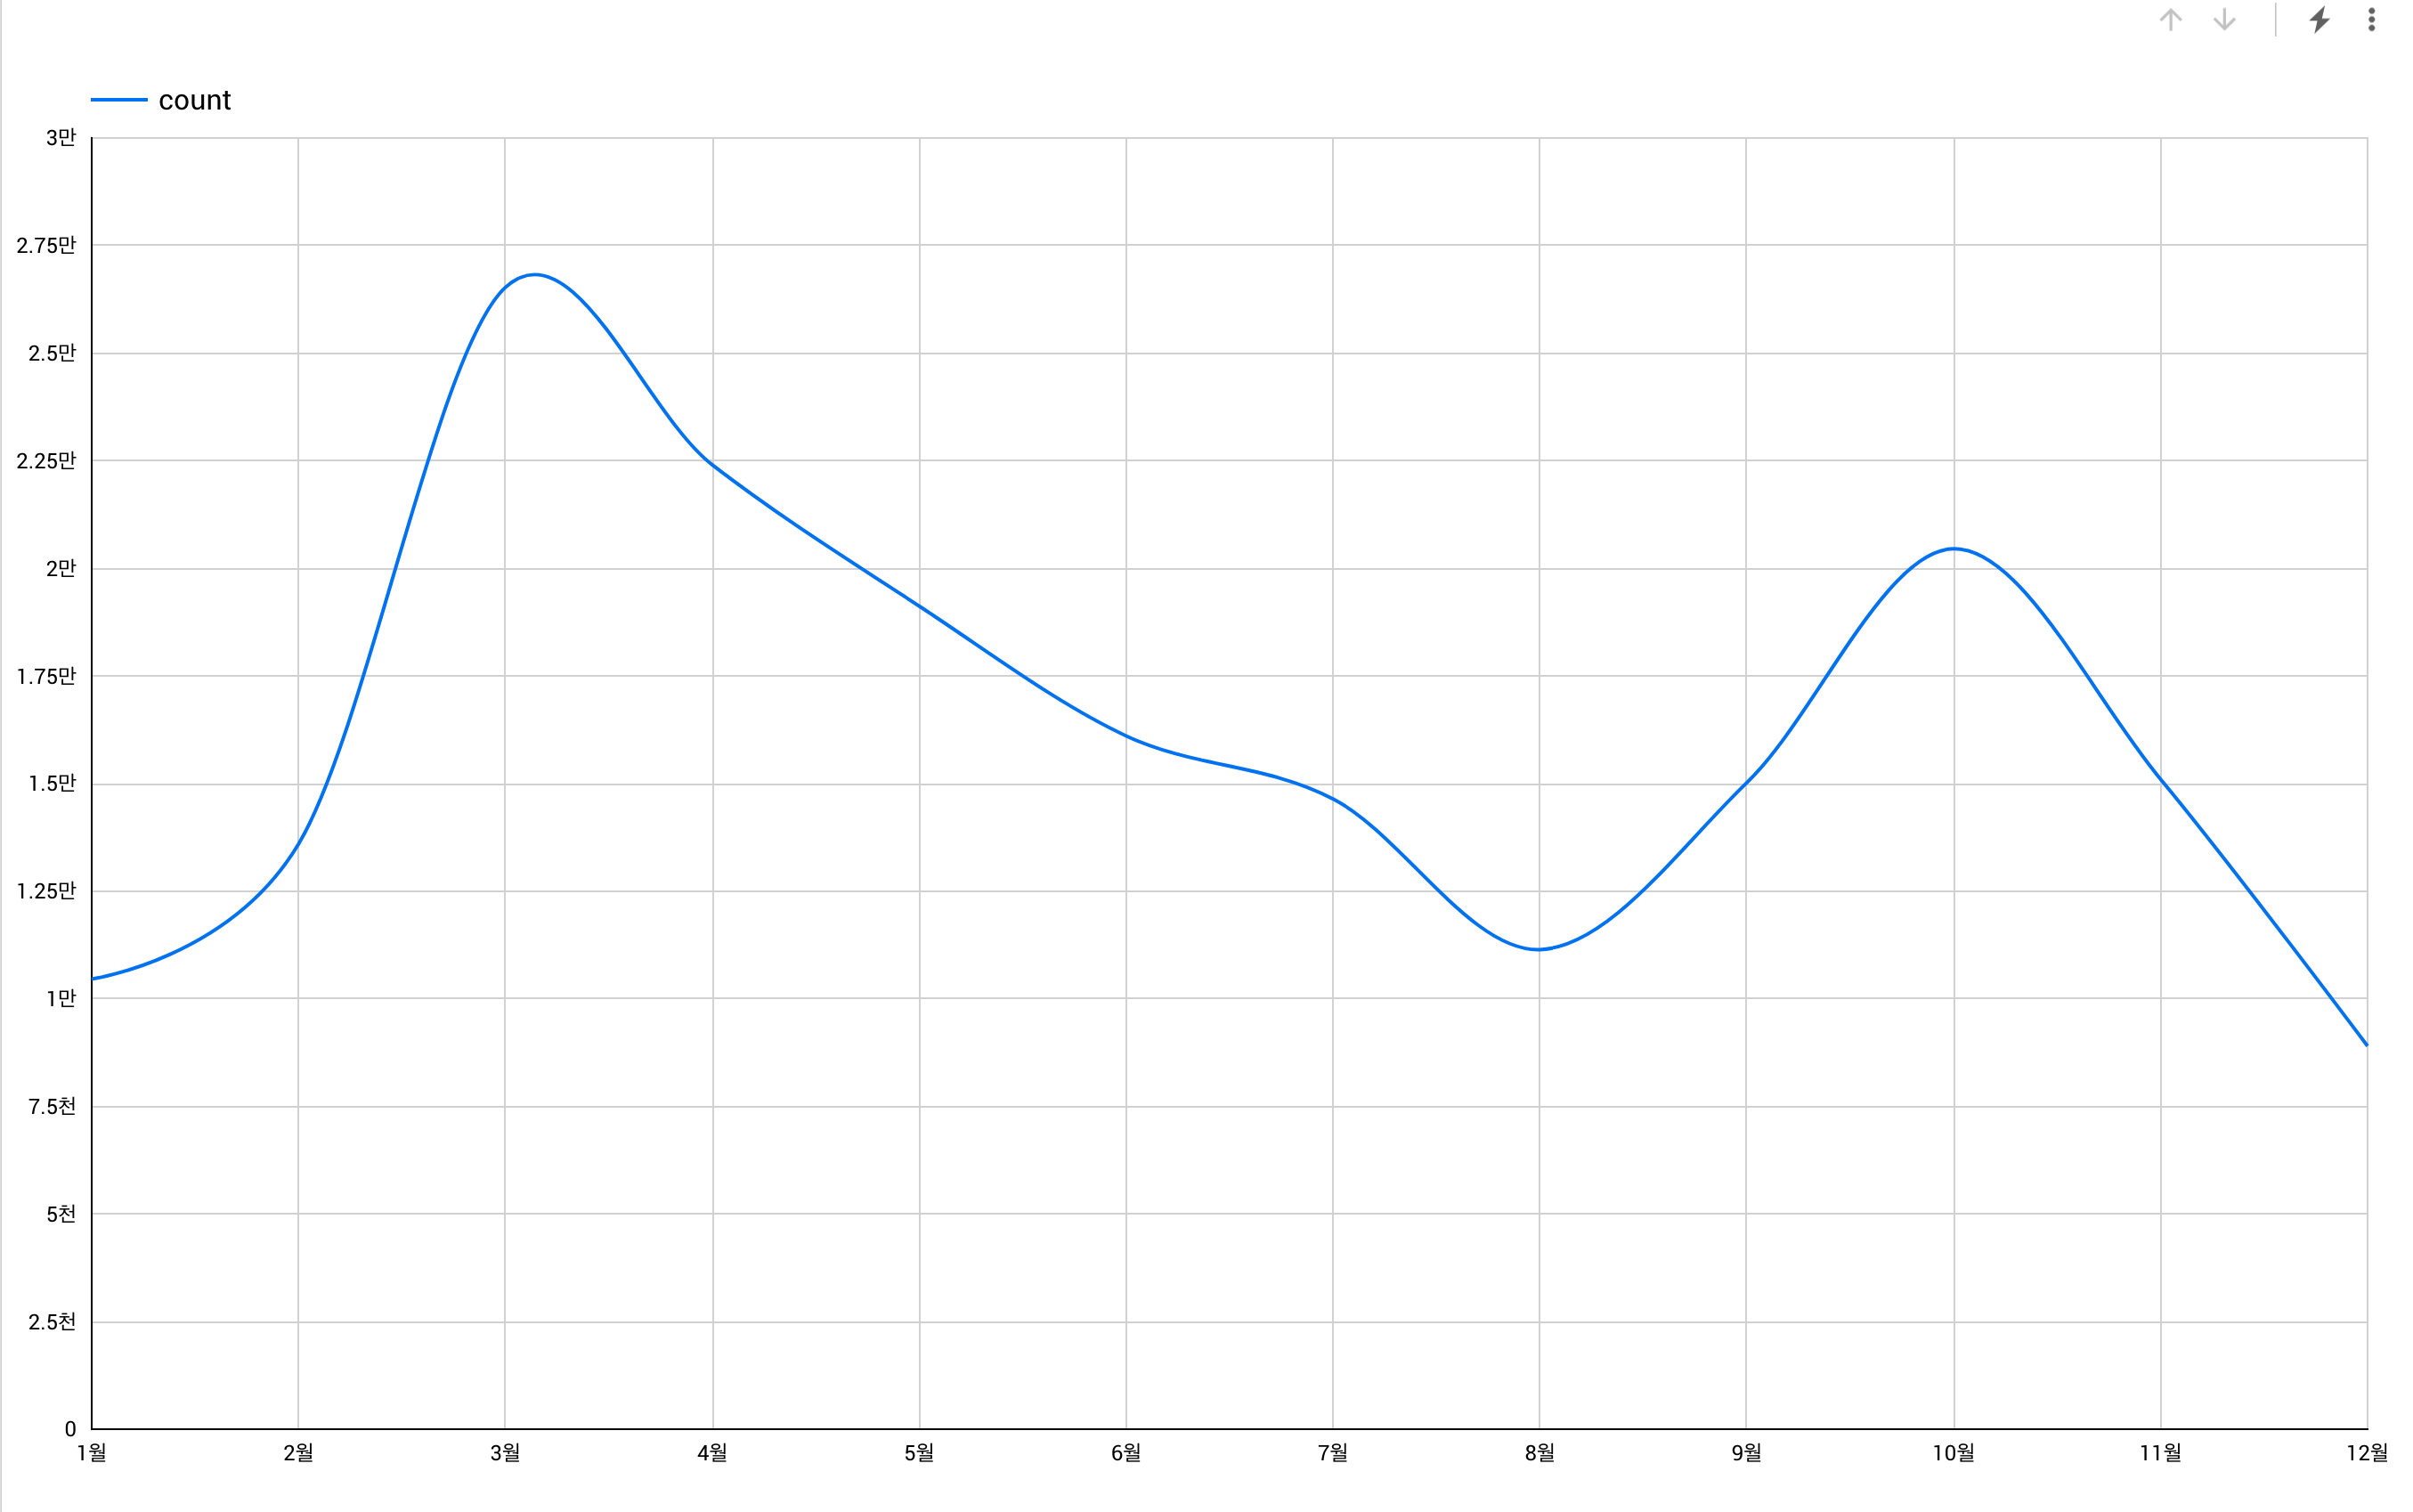
일자별 trip의 수
SELECT
  DATE(start_time) AS date,
  COUNT(trip_id) AS count
FROM `bigquery-public-data.austin_bikeshare.bikeshare_trips`
GROUP BY date
ORDER BY date
| 행 | date | count |
|---|---|---|
| 1 | 2013-12-21 | 103 |
| 2 | 2013-12-22 | 117 |
위 쿼리를 통해 추출한 데이터는 추가 작업 없이 datastudio에서 년, 월, 일별 시계열 차트로 분석이 가능
import pandas as pd
import matplotlib
import matplotlib.pyplot as plt
from IPython.display import set_matplotlib_formats
import seaborn as sns

matplotlib.rc('font', family = 'AppleGothic')
set_matplotlib_formats('retina')
matplotlib.rc('axes', unicode_minus = False)
query = """
 SELECT
  DATETIME(start_time) AS date,
  COUNT(trip_id) AS count
FROM `bigquery-public-data.austin_bikeshare.bikeshare_trips`
GROUP BY date
ORDER BY date
"""
df = pd.read_gbq(query = query, project_id='******', dialect='standard')

df.head()
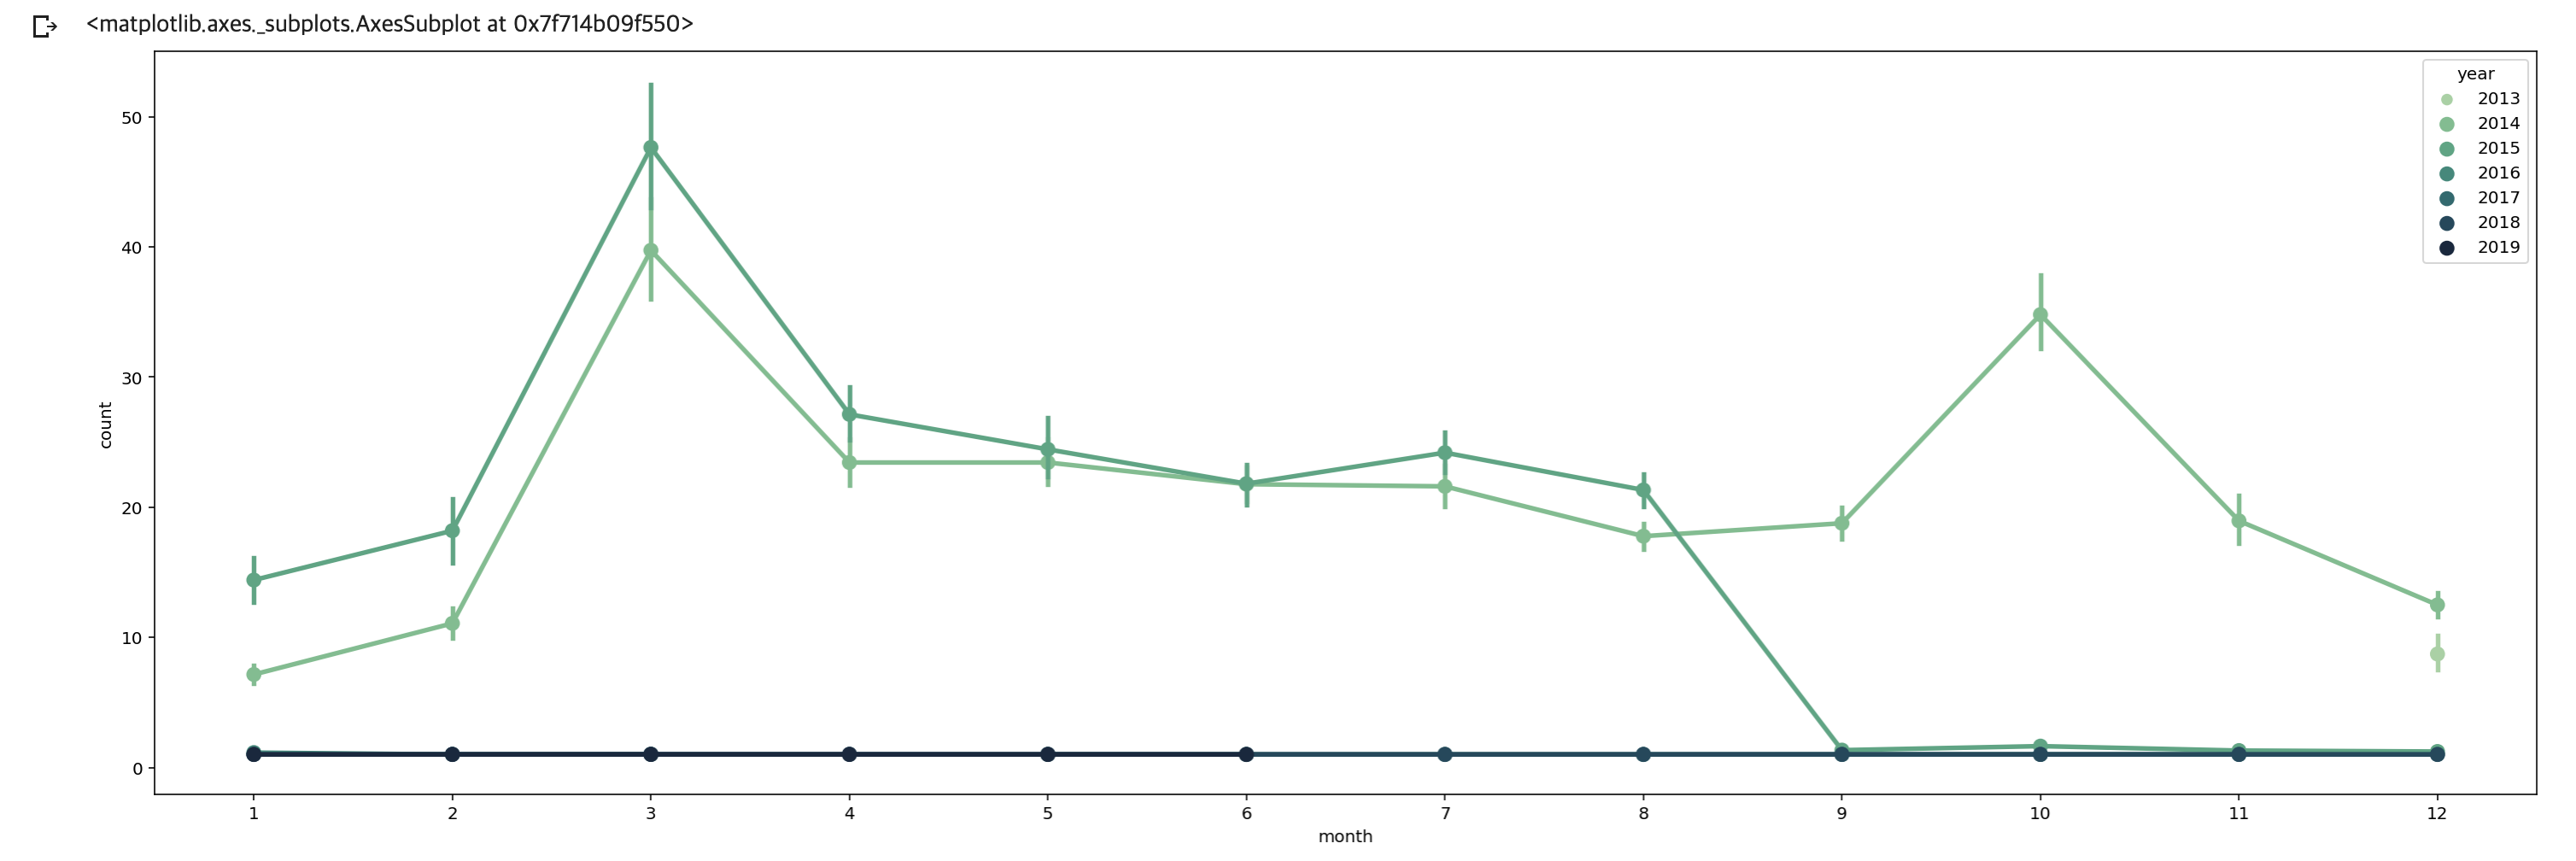
df['year'] = df['date'].dt.year
df['month'] = df['date'].dt.month
df['day'] = df['date'].dt.day
df['hour'] = df['date'].dt.hour

plt.figure(figsize = [25, 8])
sns.pointplot(data = df, x = 'month', y = 'count', hue = 'year')
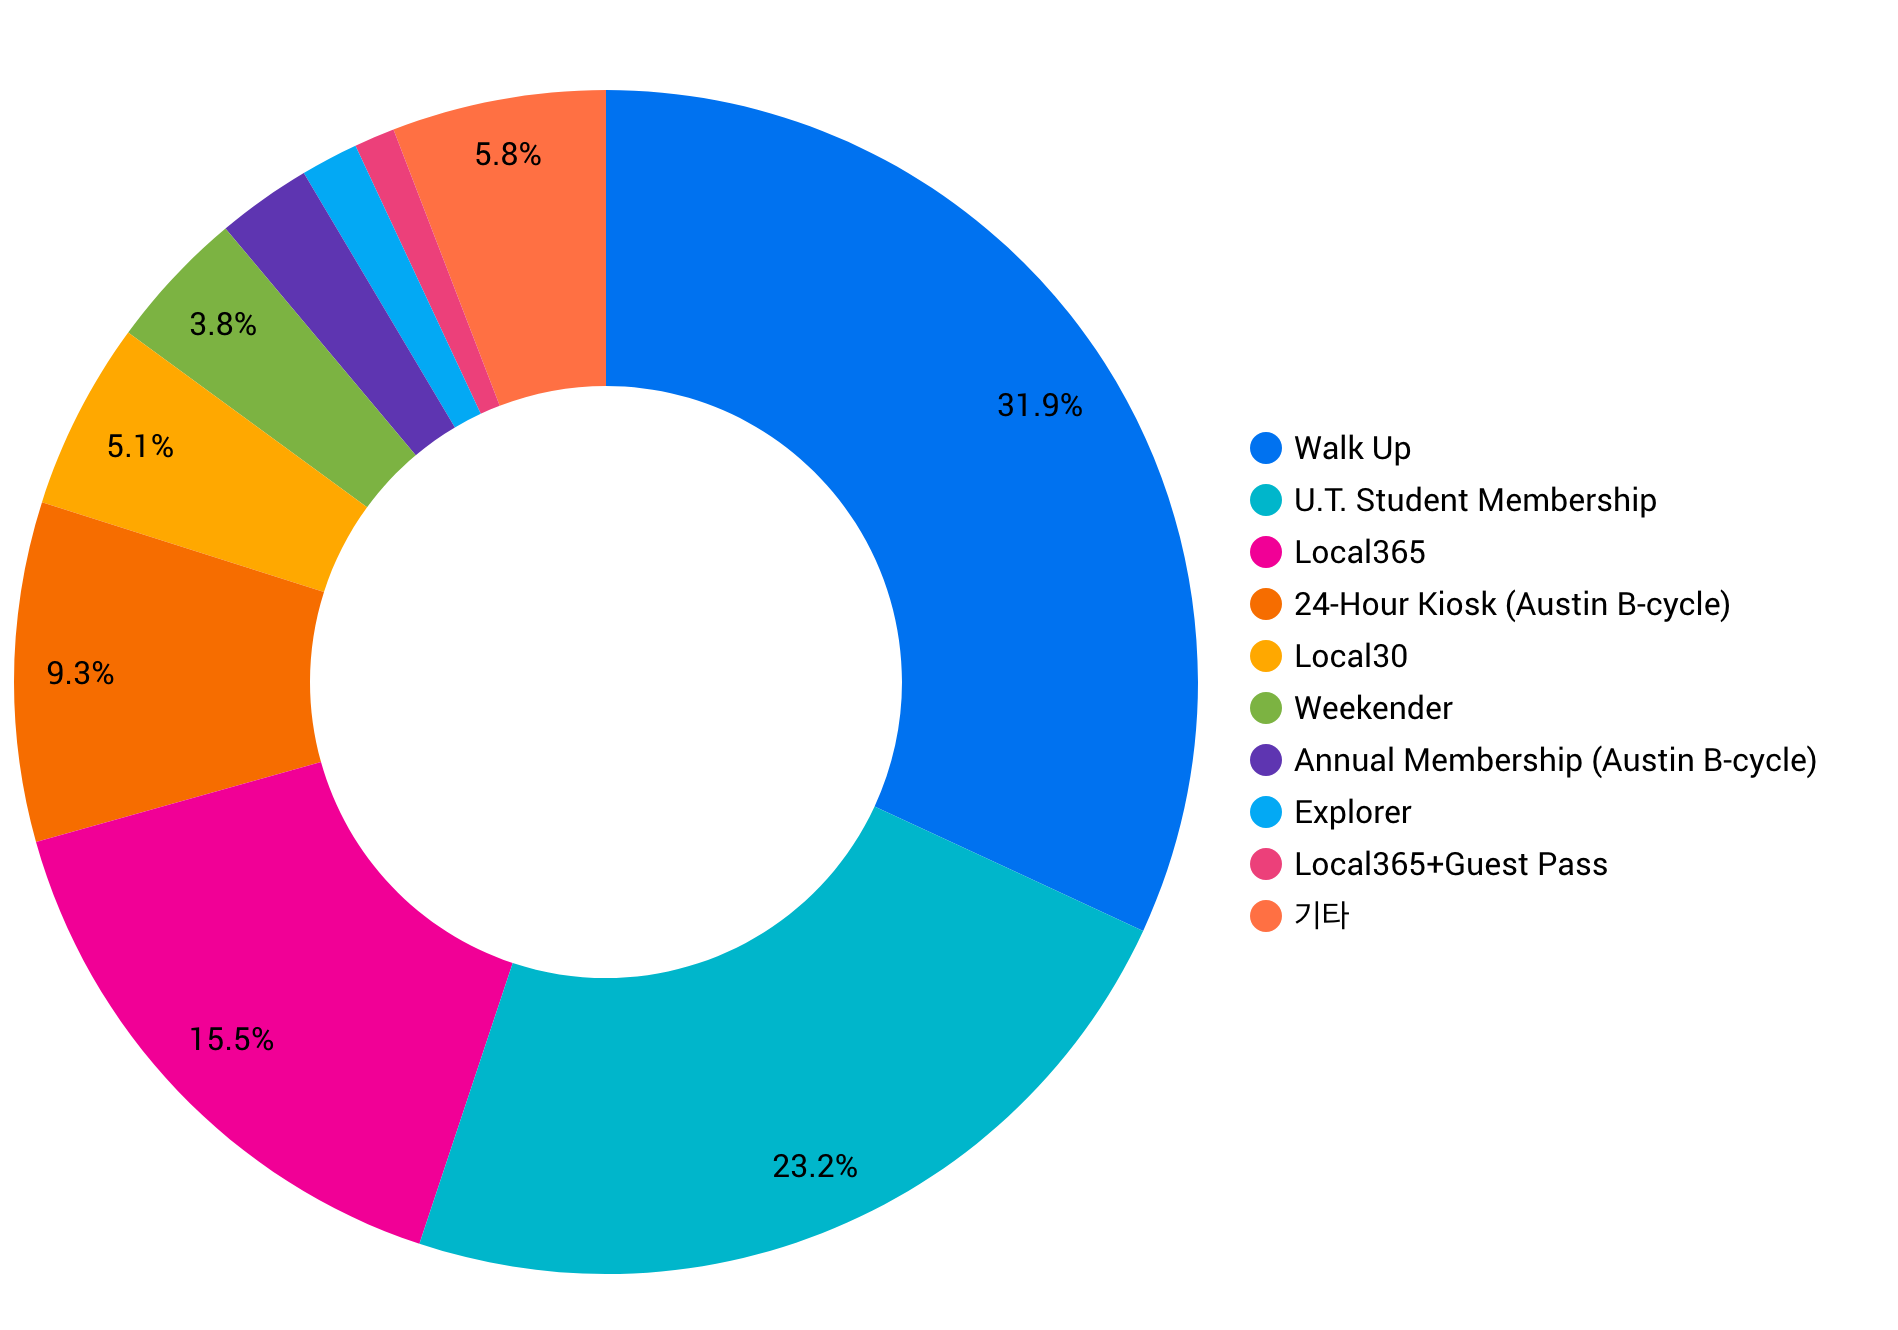
subscriber_type별 Trip Count
SELECT
  subscriber_type,
  COUNT(trip_id) AS count
 FROM `bigquery-public-data.austin_bikeshare.bikeshare_trips`
 GROUP BY subscriber_type
 ORDER BY count DESC
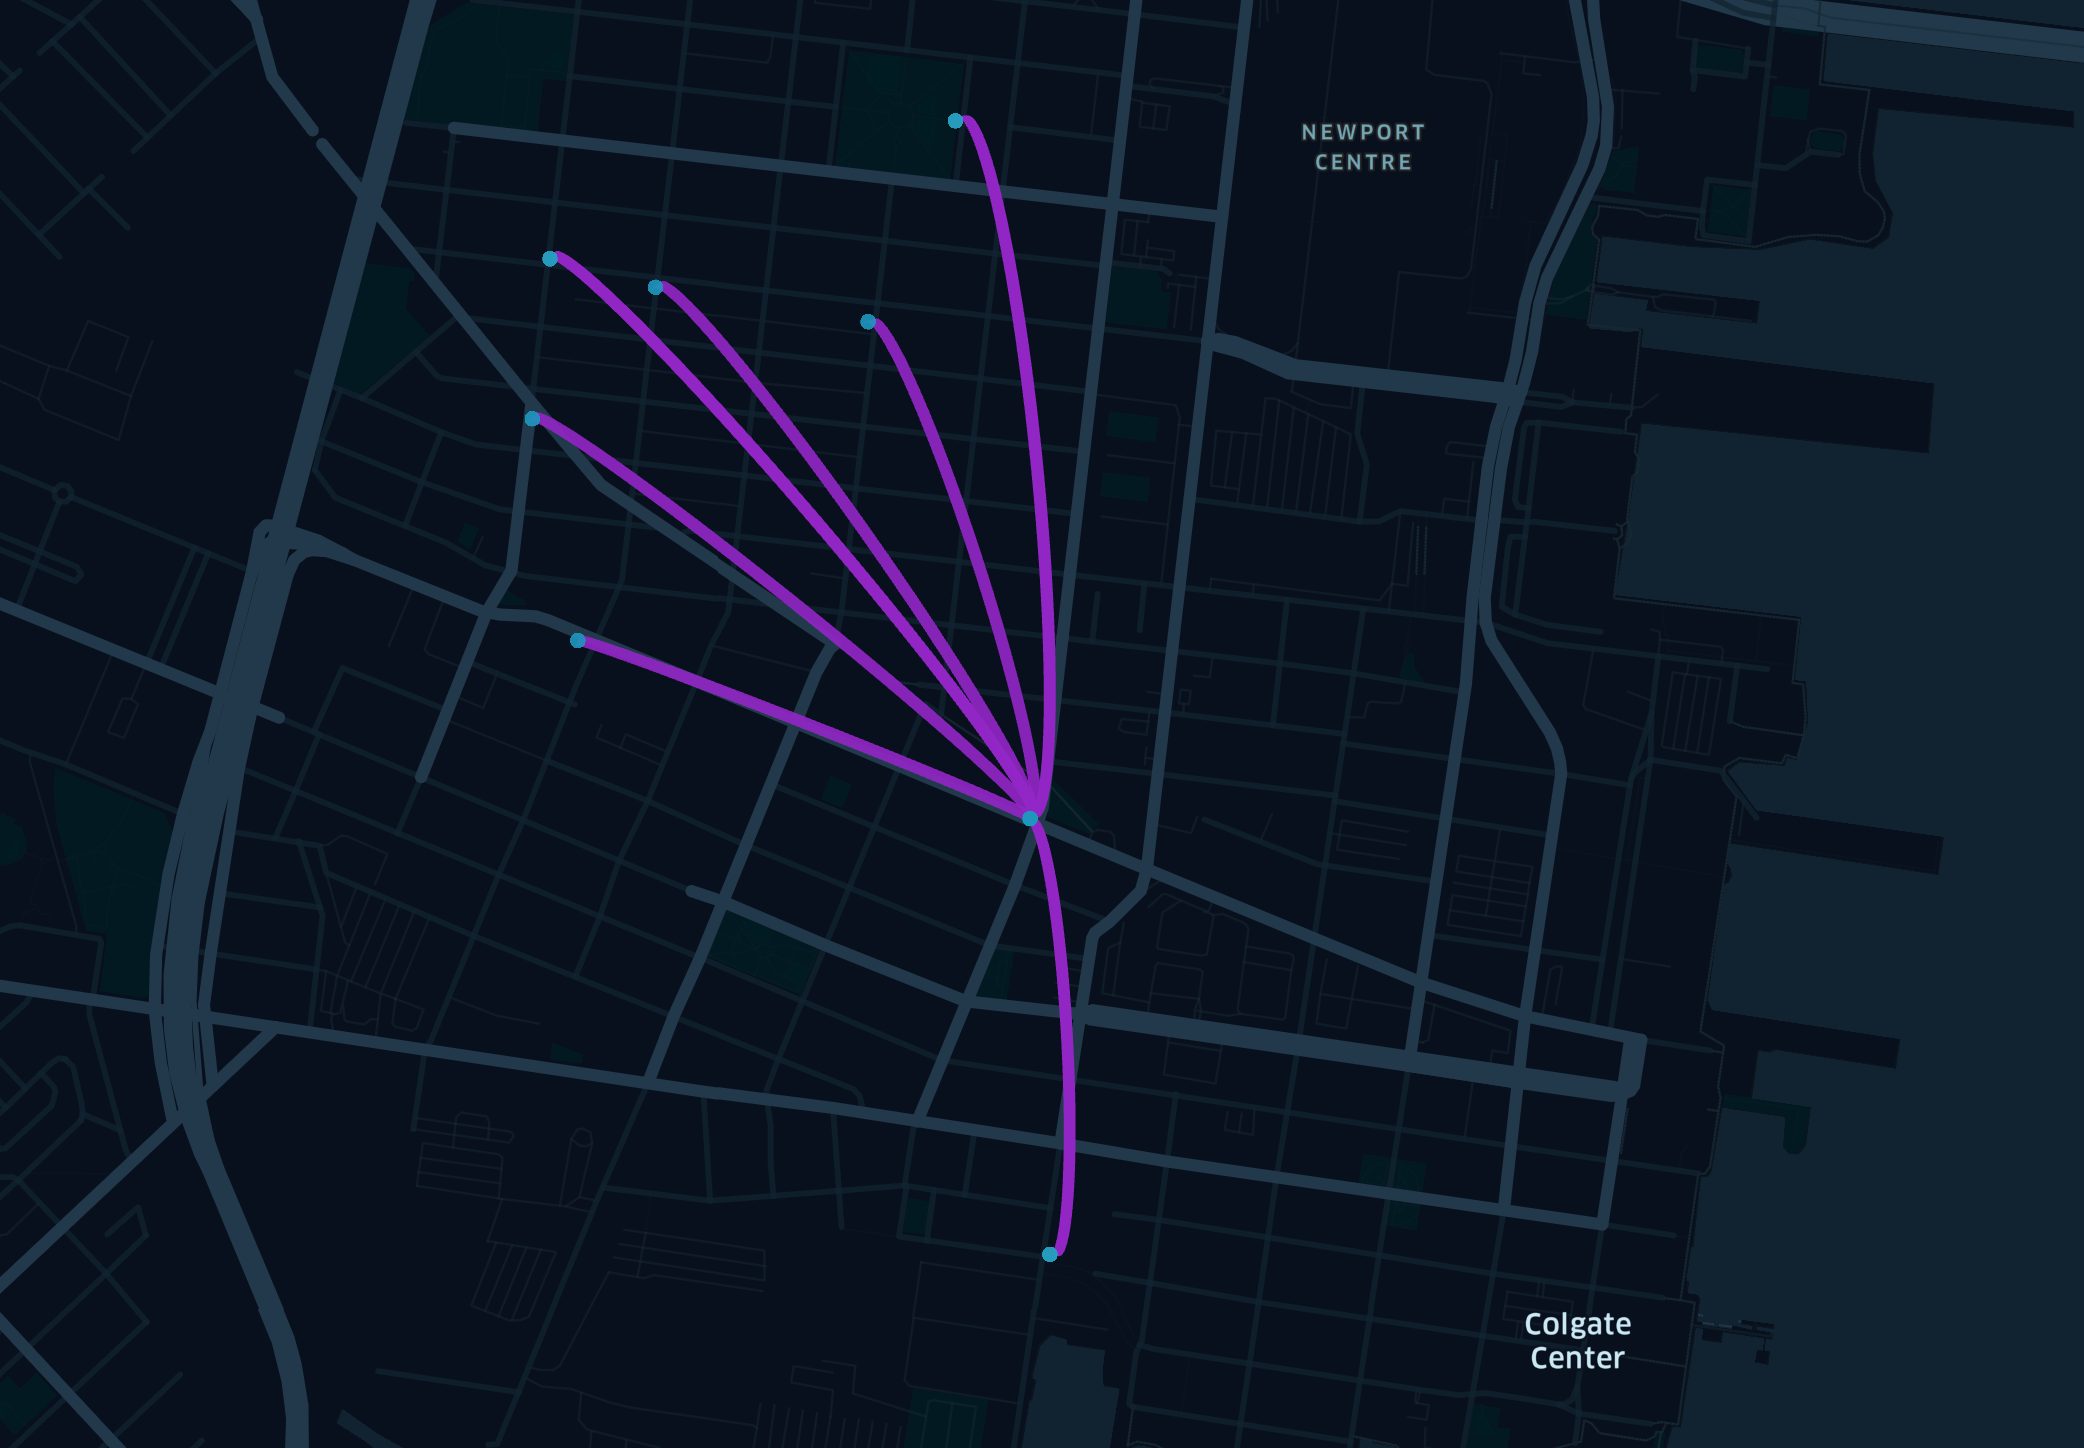
시작 station과 도착 station별 Trip Count(Most Popular Roads)
SELECT
  start_station_id,
  end_station_id,
  COUNT(trip_id) AS trip_cnt
FROM `bigquery-public-data.austin_bikeshare.bikeshare_trips`
GROUP BY start_station_id, end_station_id
ORDER BY trip_cnt DESC
| 행 | start_station_id | end_station_id | trip_cnt |
|---|---|---|---|
| 1 | 3798 | 3798 | 13164 |
| 2 | 2575 | 2575 | 12465 |
table = pd.pivot_table(raw_data,
                       index = ['start station id', 'end station id'],
                       values = 'Age',
                       fill_value = 0,
                       aggfunc = len)

table.columns = ['total']
table = table.sort_values(by = 'total', ascending = False)

table.head(10)
start station latitude, start station longitude, end station latitude, end station longitude 정보를 추가하여 상위 10개 구간 Trip Count에 대한 지리 정보 시각화
시간대 별 Trip Count
SELECT start_hour, COUNT(trip_id) as cnt
FROM (
  SELECT EXTRACT(hour FROM start_time) AS start_hour, *
  FROM `bigquery-public-data.austin_bikeshare.bikeshare_trips`
)
GROUP BY start_hour
ORDER BY cnt DESC
SELECT start_hour, COUNT(trip_id) as cnt
FROM (
  SELECT DATETIME_TRUNC(DATETIME(start_time), hour) AS start_hour, *
  FROM `bigquery-public-data.austin_bikeshare.bikeshare_trips`
)
GROUP BY start_hour
ORDER BY cnt DESC
요일별 Trip Count
SELECT weekday, COUNT(trip_id) AS count
FROM (
  SELECT FORMAT_DATETIME("%u", DATETIME(start_time)) AS weekday,
  *
  FROM `bigquery-public-data.austin_bikeshare.bikeshare_trips`
  )
 GROUP BY weekday
 ORDER BY count desc
요일/시간대별 Trip Count
SELECT weekday, start_hour, COUNT(trip_id) AS count
FROM (
  SELECT DATETIME_TRUNC(DATETIME(start_time), hour) AS start_hour,
  FORMAT_DATETIME("%u", DATETIME(start_time)) AS weekday,
  *
  FROM `bigquery-public-data.austin_bikeshare.bikeshare_trips`
  )
 GROUP BY weekday, start_hour
 ORDER BY count desc
Quiz 1
Are more bike trips were taken by subscribers or non-subscribers(“Customers”)? How does this compare to the total trips started at each station?
Below is a preview of trip table.
SELECT
  start_station,
  subscription_type,
  COUNT(start_date) AS trips,
  (SELECT COUNT(start_date)
    FROM trip AS t1
    WHERE t.start_station =
          t1.start_station) AS station_total
FROM trip AS t
GROUP BY start_station, subscription_type
ORDER BY start_station
LTMIT 3;
Quiz 2
Can you calculate a running total of minutes spent on bicycle trips per day?
Below is a preview of trips table
| duration | start_date | start_station |
|---|---|---|
| 298 | 8/29/13 | 5th at Ho |
| 431 | 9/29/13 | South Van |
SELECT
  start_station,
  start_date,
  duration,
  SUM(duration) OVER (ORDER BY start_date
          ROWSBETWEEN UNBOUNDED PRECEDING
          AND CURRENT ROW) AS running_total
FROM trips
LIMIT 5;
| start_station | start_date | duration | running_total |
|---|---|---|---|
| South Van | 2013-08-29 | 431 | 431 |
| 5th at How | 2013-08-29 | 298 | 729 |
Quiz 3
Can you create a simple window function to calculate the overall count of bicycle docks at a station without grouping the result?
Below is a preview of station table
| name | docks |
|---|---|
| San Jose D | 27 |
| San Jose C | 15 |
SELECT
  name,
  docks,
  COUNT(docks) OVER() AS total_docks
FROM stations
LIMIT 2;
| name | docks | total_docks |
|---|---|---|
| San Jose D | 27 | 70 |
| San Jose C | 15 | 70 |
참고 자료